Banknote forgery detection
Banknote forgery detection
The problem: detection of forged banknotes
Butterfly AI Platform can classify images, and perform prediction based on images, when the image characteristics has been converted to rows of numerical or text features and put into a tabular data format in a CSV file. As an example, in this project we demonstrate how Butterfly AI can help banks detect banknote forgery with accuracy of 100% (F1=1 score).
The data
For this case, we’re goingt o develop a binary classification model to detect which banknotes are fake.
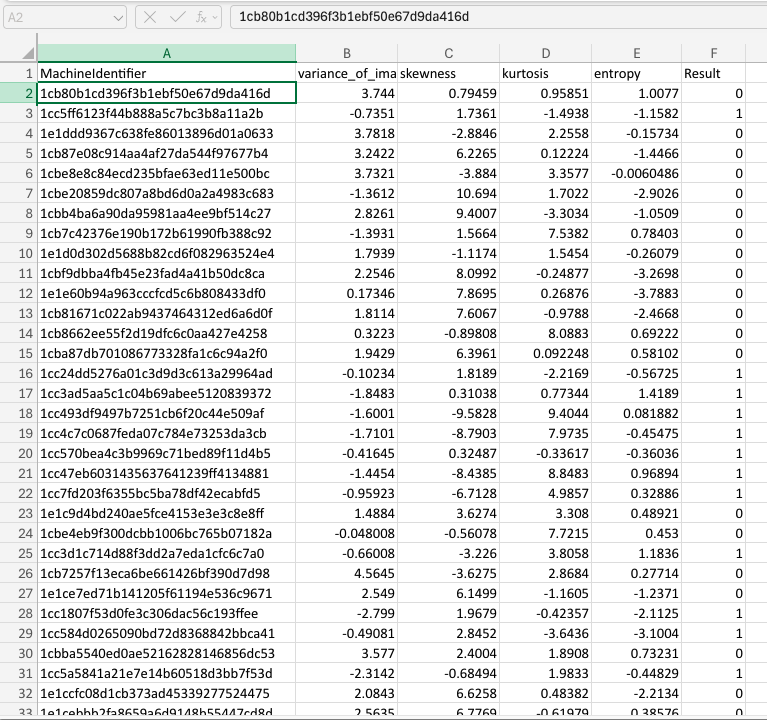
Within the labelled training csv file, each row represents the characteristics of an image for a single banknote. The data features are:
| Parameter | Type / Units | Description |
|---|---|---|
MachineIdentifier |
identifier | ID of the individual banknote. |
variance_of_image |
continuous | Variance of the Wavelet Transformed banknote image. |
skewness |
continuous | Skewness of the Wavelet Transformed banknote image. |
kurtosis |
continuous | Kurtosis of the Wavelet Transformed banknote image. |
entropy |
continuous | Entropy of the banknote image. |
Result |
categorical (0/1) | Target variable — 0 if genuine, 1 if fraudulent. |
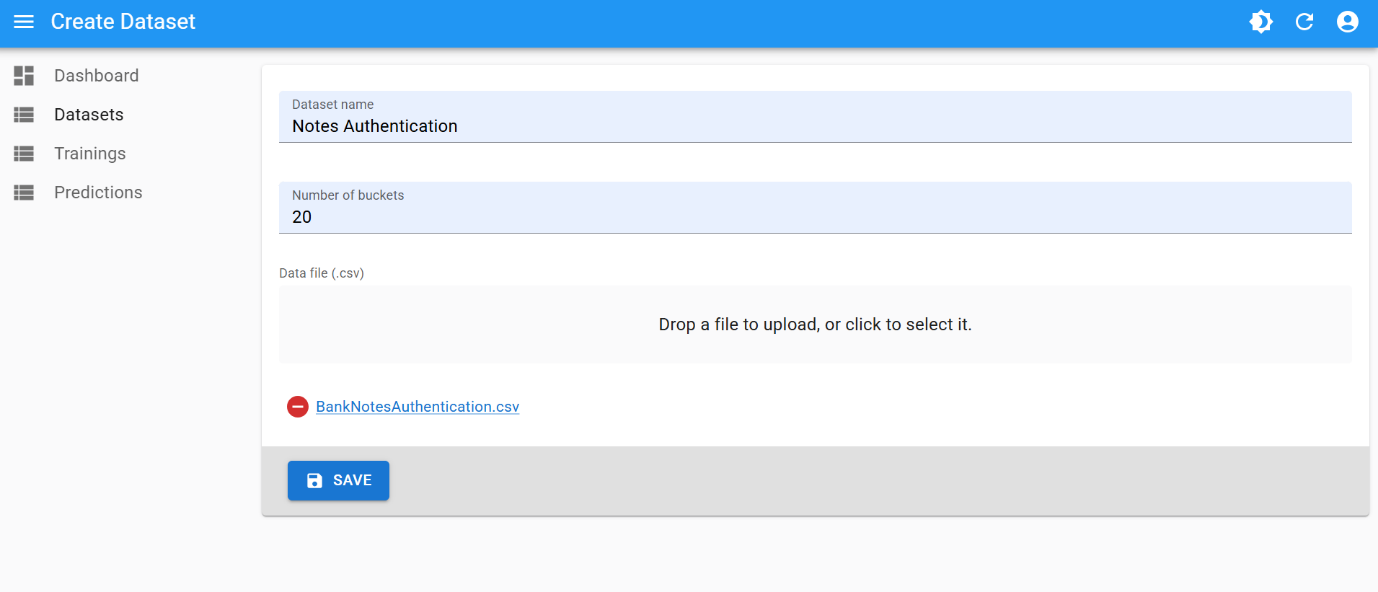
Dataset creation
Use the following parameters for dataset creation:
- number of buckets:
20
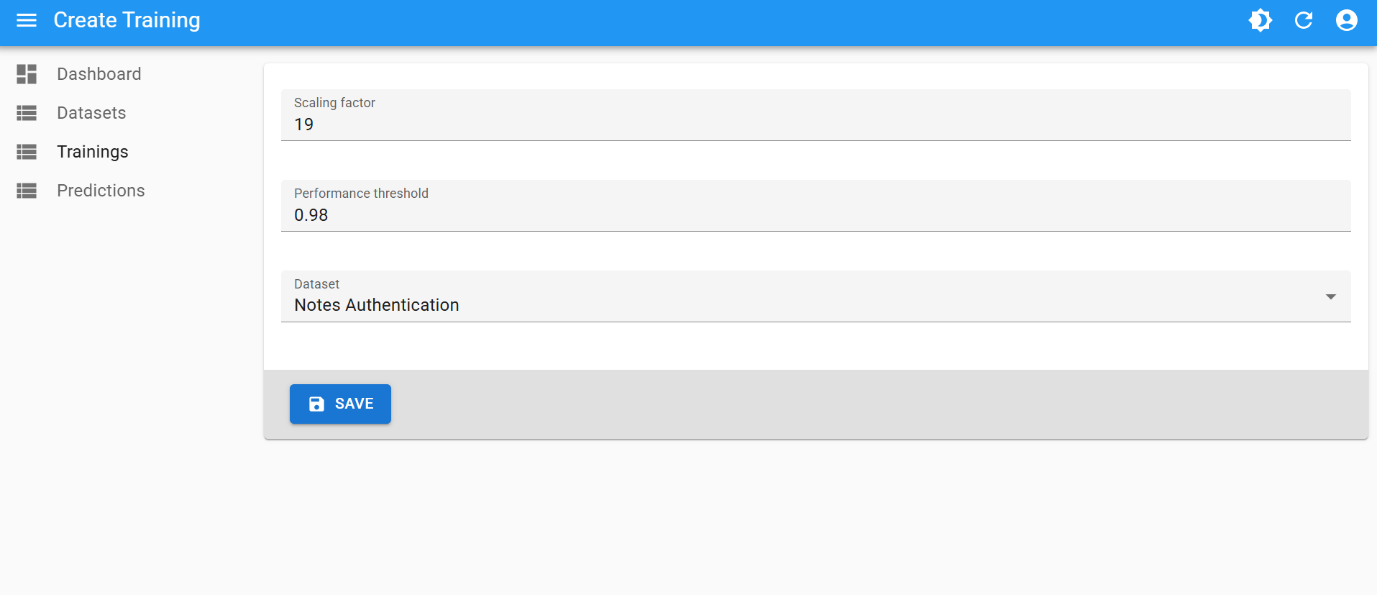
Training
This is the best training attempt:
- Scaling factor:
19 - Performance Threshold:
0.98
And the created champion model:
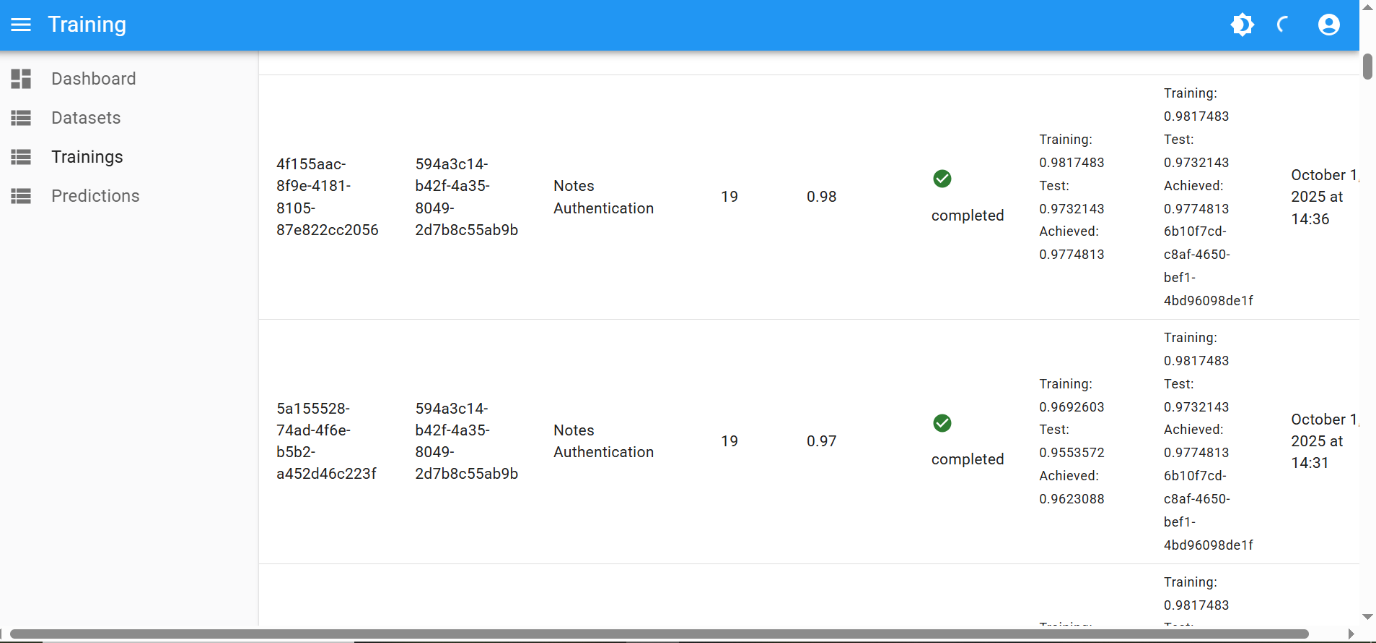
The final performance of 0.98 was achieved after few iterations of hyperparameter tuning:
| Number of Buckets | Scaling Factor | Performance Threshold |
|---|---|---|
| 20 | 19 | 0.80 |
| 20 | 19 | 0.95 |
| 20 | 19 | 0.95 |
| 20 | 19 | 0.97 |
| 20 | 19 | 0.98 |
Final result
When performing binary classifications or predictions, Butterfly AI platform’s underlying proprietary algorithms calculate the probability of certainty for a prediction outcome.
- One label (e.g.
1) will be selected when the probability is equal or above0.5 - and the other one (e.g.
0) will be selected when the probability is below0.5
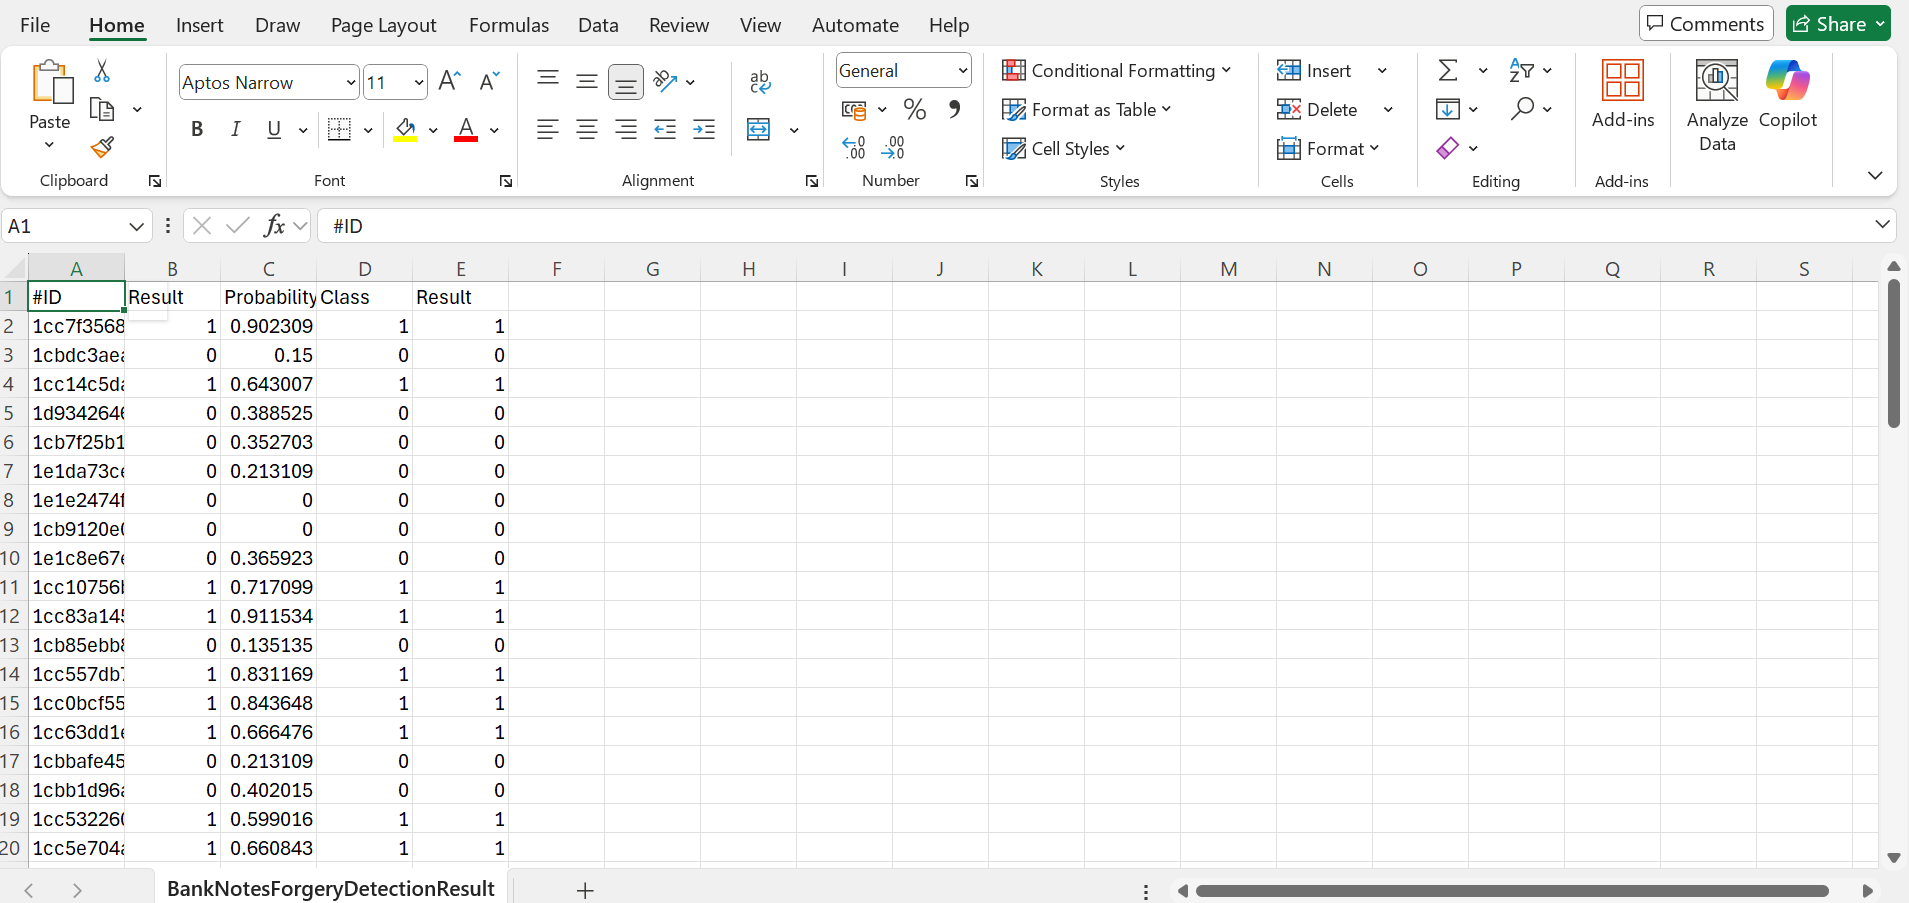
The closer the value is to 0 or 1, the more certain is the prediction. The probability is presented in a dedicated column in the prediction result file.
Using this unseen unlabelled data, the resulting labelled CSV looks like this: