Credit Card Approval
Credit card application approvals
The problem: Credit Card approval
Large number of credit cards applications are processed daily by banks and financial institutions. Manual processing and analysis of those applications is time-consuming and costly. The main drawback of the manual process is potential costly human errors. Many of the applications may get rejected due to reasons such as unemployment, low income levels, or too many inquiries on an individual’s credit report.
In this document, we describe how Butterfly AI platform can help banks and financial institutions make better informed decisions on the credit card applications achieving 95% accuracy.
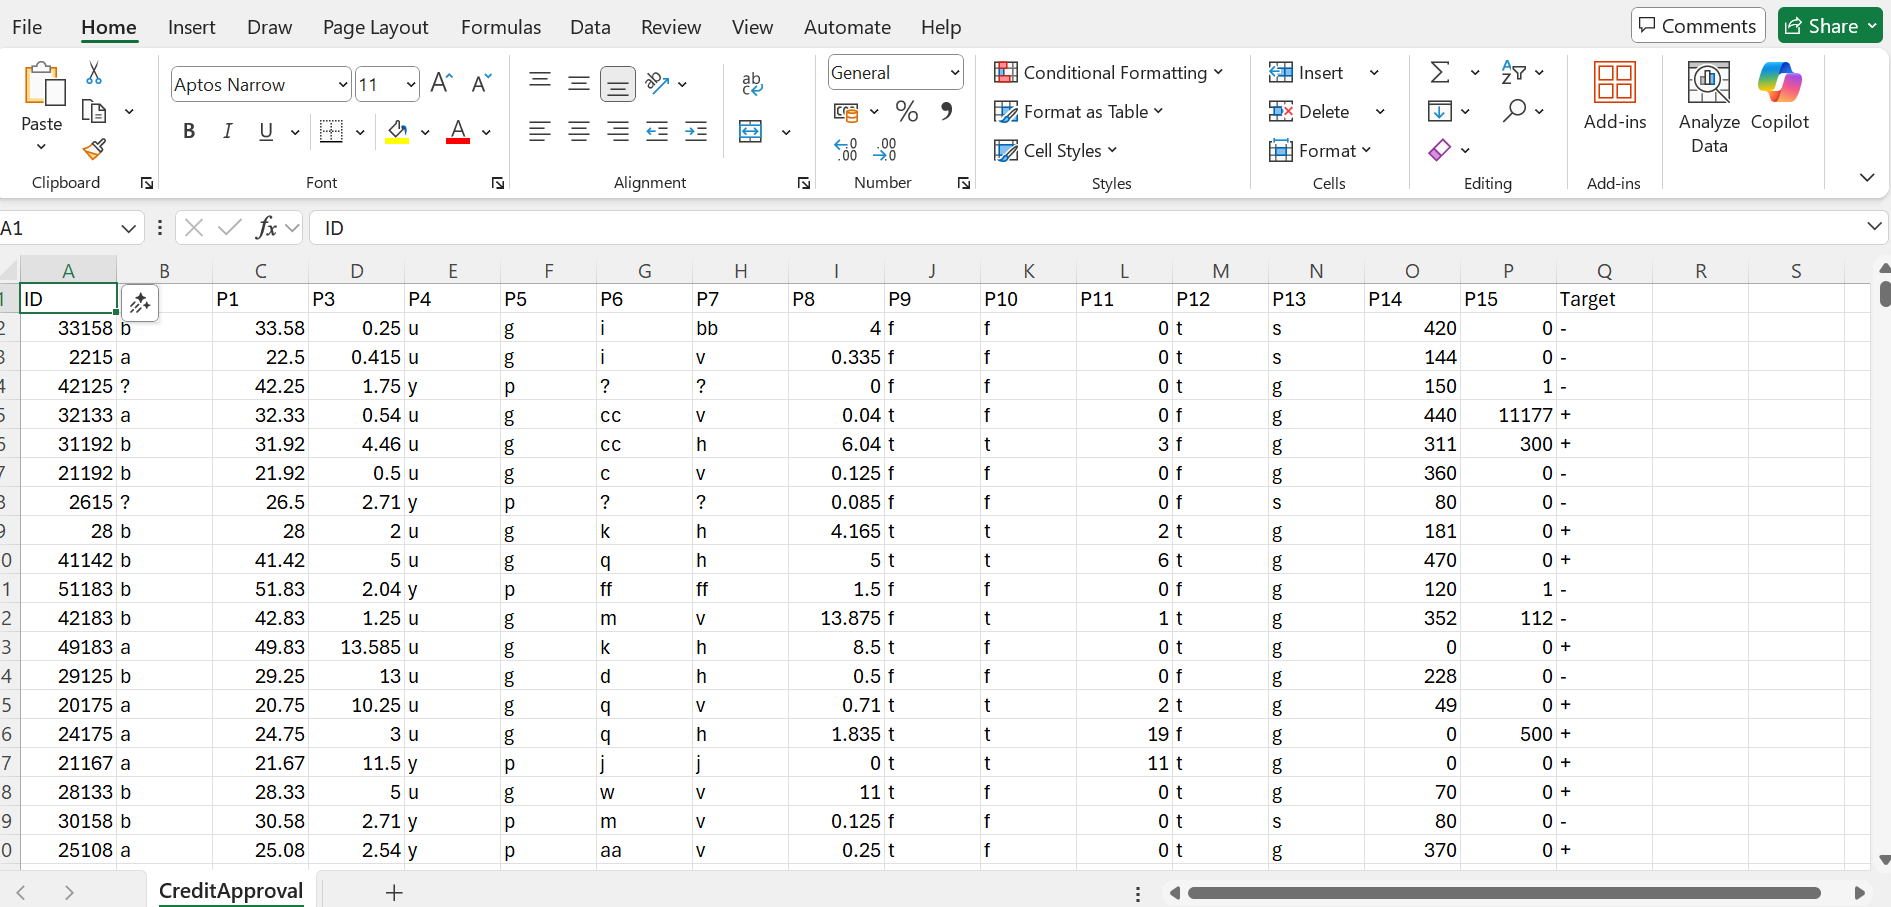
The data
The training dataset (CreditCardApproval.csv) is based on the data from the following reference:
Quinlan, J. (1987). Credit Approval [Dataset]. UCI Machine Learning Repositoryhttps://doi.org/10.24432/C5FS30
The following changes have been made to the original data:
- The rows with unknown values have been removed from the dataset
- The rows in the csv file were then shuffled randomly
- A first ID column is also added.
The data includes features such as:
income levelnumber of inquiries on an individual’s credit reportcredit score- …
The last column is the target or an acceptable decision on the application where + represents a credit card application approval and - represents a rejection. Butterfly AI platform has taken 10% of the data, unlabel it and used it as an unlabelled prediction dataset which is unseen by the training process.
Dataset creation
Use the following parameters for dataset creation:
- number of buckets:
20
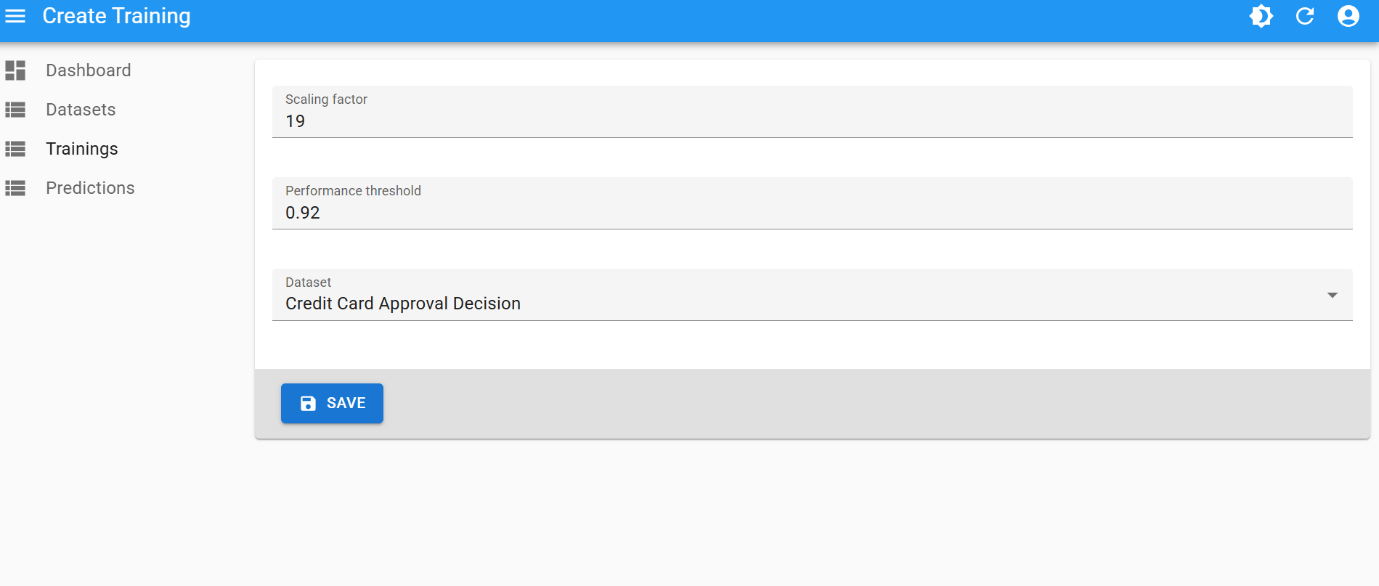
Training
This is the best training attempt:
- scaling factor:
19 - performance threshold:
0.99
And the created champion model:
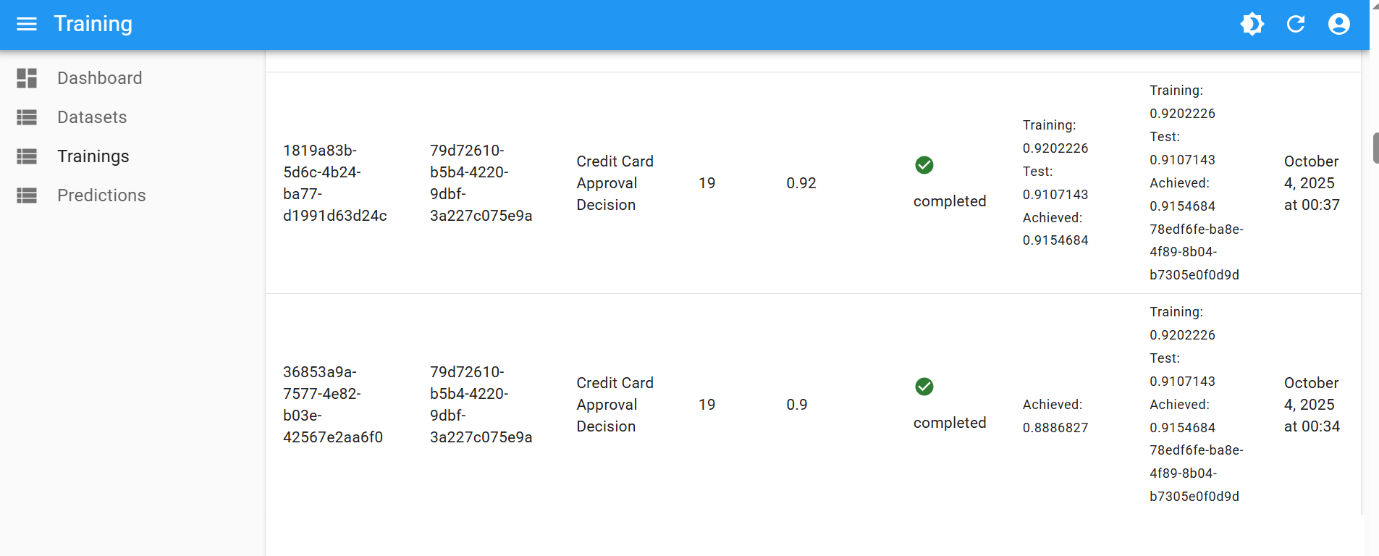
The final performance of 0.99 was achieved after few iterations of hyperparameter tuning:
| Number of Buckets | Scaling Factor | Performance Threshold |
|---|---|---|
| 10 | 19 | 0.80 |
| 10 | 19 | 0.90 |
| 10 | 19 | 0.92 |
Final result
When performing binary classifications or predictions, Butterfly AI platform’s underlying proprietary algorithms calculate the probability of certainty for a prediction outcome.
- One label (e.g.
1) will be selected when the probability is equal or above0.5 - and the other one (e.g.
0) will be selected when the probability is below0.5
The closer the value is to 0 or 1, the more certain is the prediction. The probability is presented in a dedicated column in the prediction result file.
Using this unseen unlabelled data, the resulting CSV looks like this: