Retail self-checkout fraud
Detect fraudulent self-checkout activity
The problem: self-checkout fraudulent activity detection
The number of self-checkout stations is on the rise, helping avoid long lines while speeding up the paying process for individual customers. But retailers should be able to decide which purchases to check to prevent revenue loss and expose fraudsters without annoying innocent customers.
Butterfly AI platform can help retailer detect the suspicious self-checkout activities seamlessly. We use a labelled training data based on anonymous real-life customer self-checkout data to train the models.
The data
In this case, we’re goingt o develop a binary classification model to detect which self-checkouts to check.
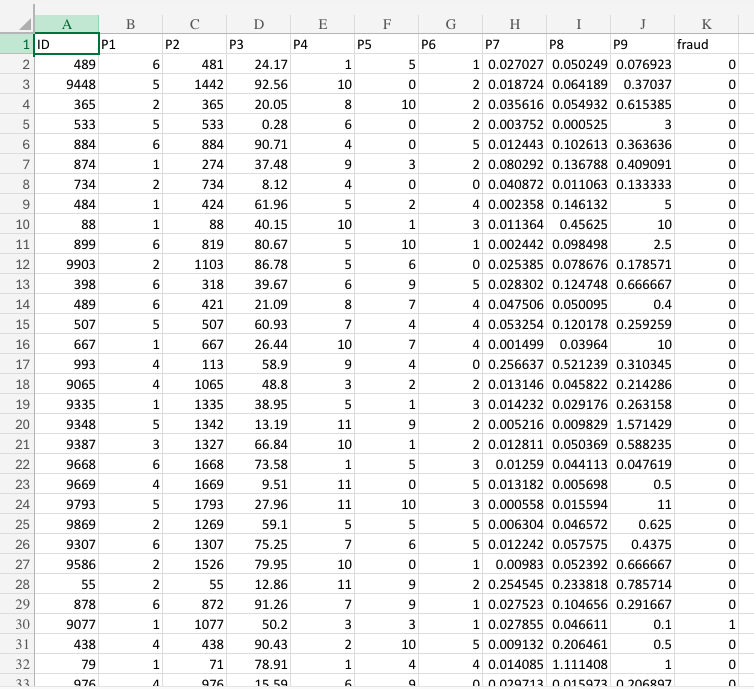
The base dataset (SelfCheckoutFraud.csv) includes the following features:
| Parameter | Units / Type | Description |
|---|---|---|
ID |
identifier | ID of the self-checkout purchase session. |
P1 |
numeric (score) | Trust level in the customer based on past purchase history, credit history, etc. |
P2 |
seconds | Total scan time in seconds. |
P3 |
seconds | Total shopping time. |
P4 |
count | Number of voids of line items. |
P5 |
count | Number of scans without registration. |
P6 |
count | Number of quantity modifications. |
P7 |
rate (items/sec) | Number of scanned line items per second. |
P8 |
rate (value/sec) | Purchase value per second. |
P9 |
rate (voids/position) | Number of line item voids per position. |
Fraud |
categorical (0/1) | Target variable — 0 if normal, 1 if fraudulent. |
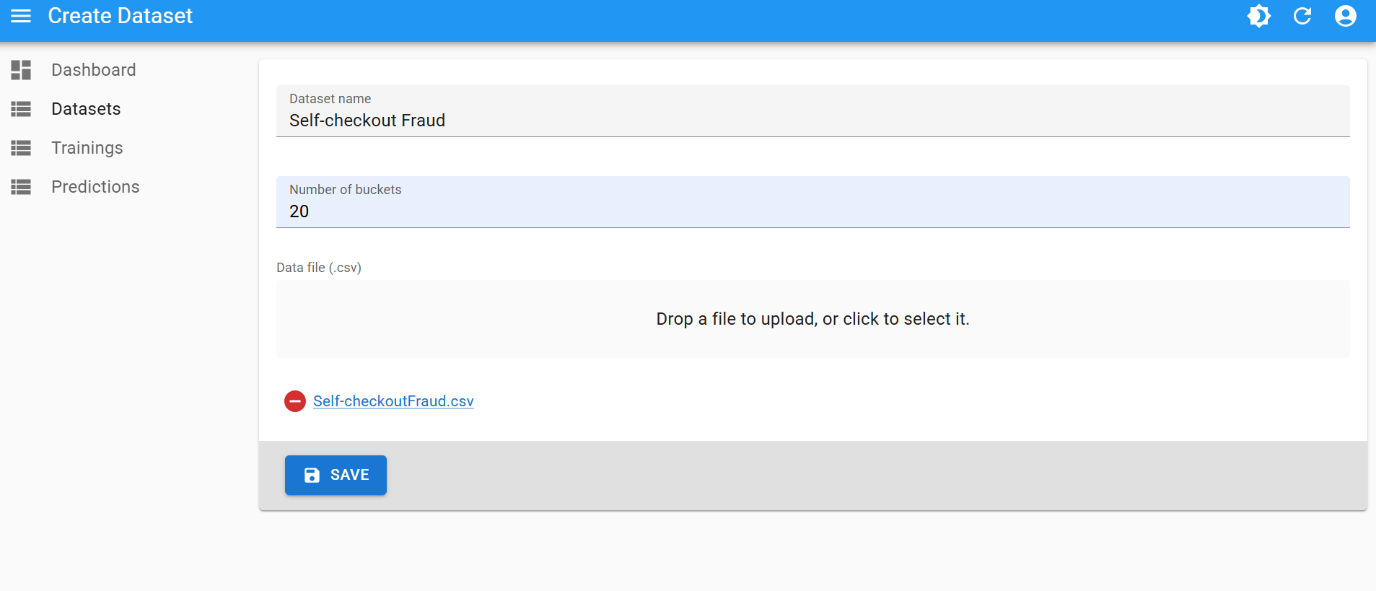
Dataset creation
Use the following parameters for dataset creation:
- number of buckets:
20
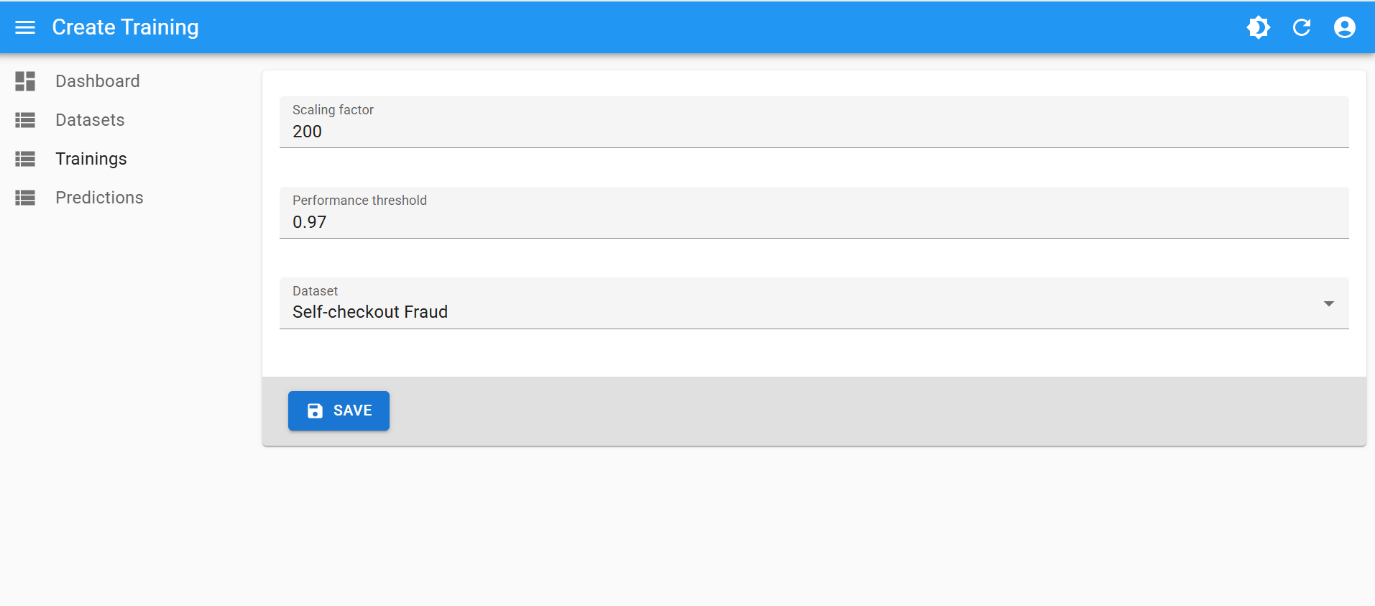
Training
This is the best training attempt:
- scaling factor:
200 - performance threshold:
0.97
And the created champion model:
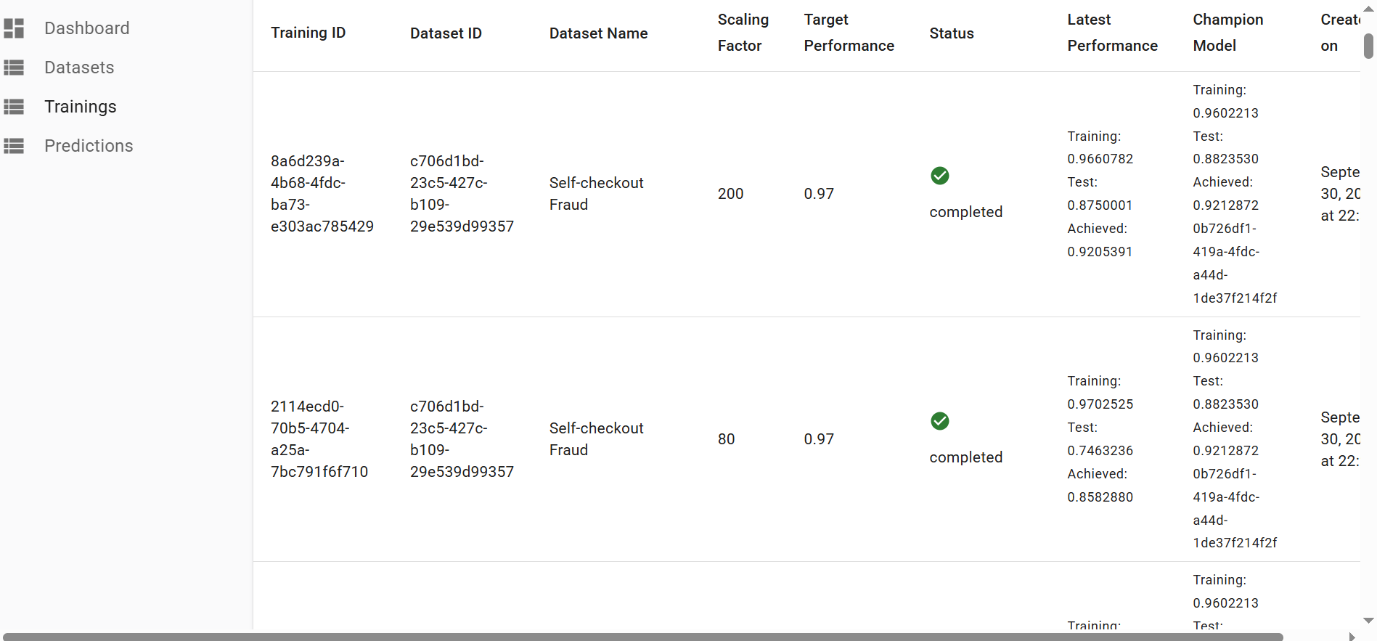
The final performance of 0.97 was achieved after few iterations of hyperparameter tuning:
| Number of Buckets | Scaling Factor | Performance Threshold |
|---|---|---|
| 20 | 19 | 0.80 |
| 20 | 19 | 0.90 |
| 20 | 19 | 0.95 |
| 20 | 80 | 0.97 |
| 20 | 200 | 0.97 |
Final result
When performing binary classifications or predictions, Butterfly AI platform’s underlying proprietary algorithms calculate the probability of certainty for a prediction outcome.
- One label (e.g.
1) will be selected when the probability is equal or above0.5 - and the other one (e.g.
0) will be selected when the probability is below0.5
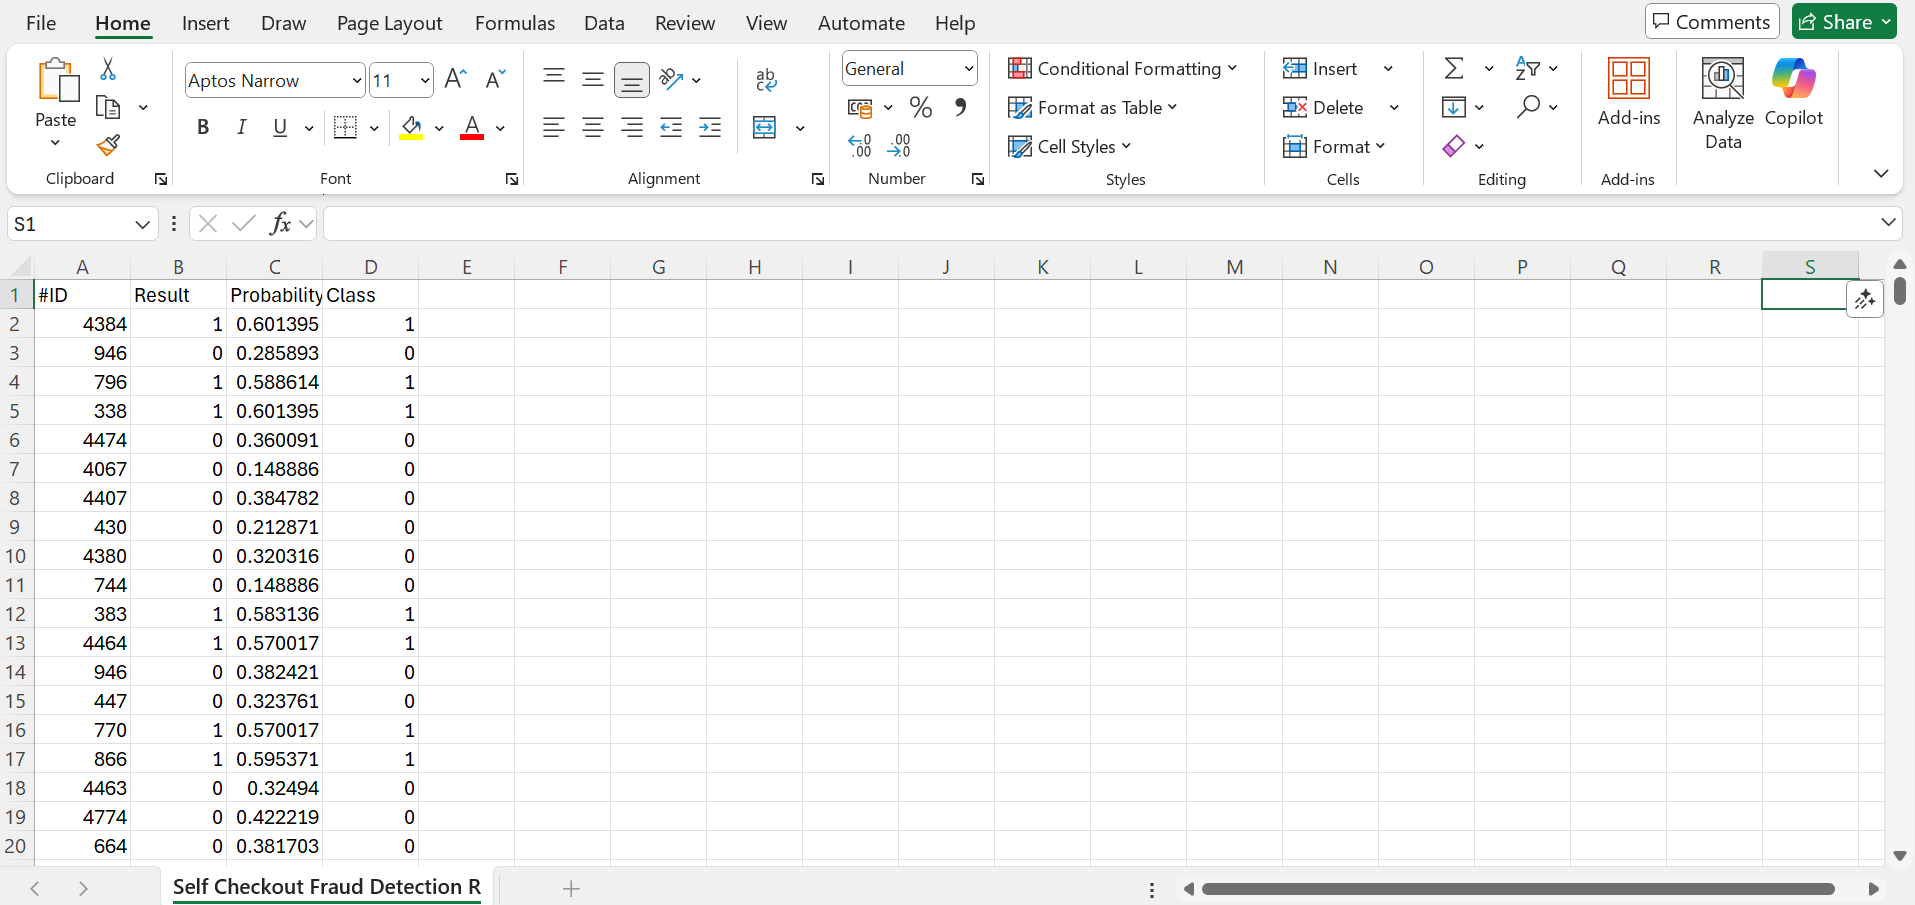
The closer the value is to 0 or 1, the more certain is the prediction. The probability is presented in a dedicated column in the prediction result file.
Using this unseen unlabelled data, the resulting labelled CSV looks like this:
- With 88% Accuracy:
27out of31fraud cases were detected successfully.